Analyzing Your MongoDB Data with Analytica
This is a guest post by Nosh Petigara, president of Analytica
Analytica is an analytics platform that makes it easy to analyze and report on data like user profiles, event logs, product catalogs, user-generated content, financial assets, or anything else you may have stored in you MongoDB database.
Assuming you had a database called ‘twitter’ and a collection called 'tweets’, which contained the JSON documents for @mongodb’s tweets from the Twitter API- here is how you’d use Analytica to calculate the most commonly used hashtags with 3 commands:
SET twitter.byHashtag = group(tweets.by(entities.hashtags.text)) //group our tweets by hashtag and store them in a calculated (virtual) collection called 'byHashtag'
SET twitter.byHashtag.count = count(tweets) // counts up the number of tweets for each hashtags in our virtual collection
SET twitter.tophashtags = orderdesc(byHashtag.by(count)) //sort the results in descending order
Analytica uses dot notion to specify what collections, documents, or properties to operate on. Each SET command in Analytica results in a computation or the transformation of a set of documents, the results of which are stored in what we call calculated properties or calculated collections. These are intermediate results, stored in Analytica (at the database, collection, or document level - depending on how you specify them), which can be used in subsequent computations. Finally the command 'twitter.tophashtags.(text, count)’ retrieves the text of the hashtags along with the count of how many tweets use that hashtag.
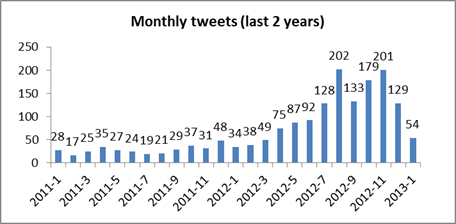
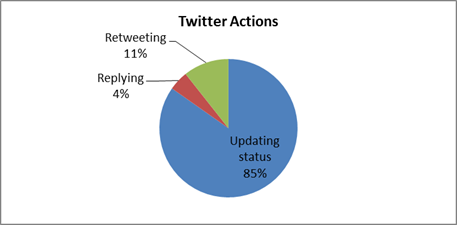
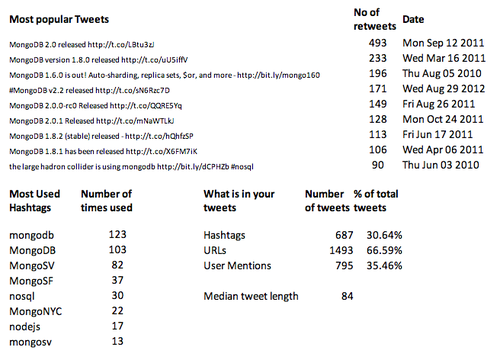
Since we wanted to graph out our results, we used Analytica’s plug in for Excel to enter a series of Analytica script expressions. In addition to calculating the most tweeted hashtags, we also looked at the frequency of tweets per month from the @mongodb account, analyzed the content of @mongodb’s tweets to see how hashtags and URLs were being used, and computed a few other metrics. With this quick analysis, we saw that @mongodb’s tweeting patterns have changed over time (a lot more tweets recently!), figured out that over 80% of @mongodb’s tweets are retweeted at least once, and learnt (perhaps not surprisingly!) that the most popular tweets are about new releases. We graphed out the results and generated the HTML page to share with the MongoDB community.
We’re holding a webinar with 10gen on February 12 so that you can learn more about Analytica and ask questions. In the webinar, we’ll go through how you can use Analytica on your own data to produce in-depth analyses, dashboards and reports and become a data whiz! In the meantime you can learn more and download the beta version of Analytica. You’ll be able to run Analytica against your own datasets or in an example we’ve put together on data from StackOverflow.
If you are looking for other datasets to try, I’d recommend checking out Twitter’s API, Foursquare’s API, the NYTimes API, or Sunlight Labs API. Each of these has JSON, CSV or XML data that you can easily import into MongoDB to start analyzing with Analytica or MongoDB’s query language and aggregation framework. We’ll also post a step-by-step guide soon, which will describe how you can run an analysis on your own twitter history. We’d love to hear from you - you can email with questions or feedback.